Greger Ottosson is a market analyst and product strategist with a keen interest in the urban mobility market. Combining deep expertise in AI, user-centric design, and enterprise software, he analyses mobility use cases and emerging solutions. Gregor is a product management leader at IBM.
January 25, 2019 Carsharing is seeing extraordinary growth globally, as cities push for greener urban mobility and individuals look beyond traditional car ownership. In response, carsharing operators have successfully launched services in most major cities, with business models ranging from station-based to free-floating [1].
Alas, the concept is proven. Now many operators are seeking to shift from a VC funded pilot-mode to a profitable long-term enterprise. There are several factors driving carshare profitability, including:
- Pricing (strategic pricing under competitive pressure)
- Fleet expansion (cost-effective acquisition of vehicles)
- Fleet management (Efficiency in vehicle maintenance and servicing)
- Utilization rate (percentage of time a vehicle is rented)
In this article we’ll focus on the last aspect for the free floating carshare model, examining how it’s possible to improve vehicle utilization from a typical 10–15% [2] to 30–40%, which represents a strong competitive position [3].
The business decisions that impact your utilization rate can be divided up into three categories; strategic, tactical, and operational. Let’s discuss…
Strategic: Designing the service for complementary use cases
In an ideal scenario, your supply would consist of a fleet of vehicles available 24 hours a day, 7 days a week. However, on any given day, a certain percentage of vehicles will be out of service due to maintenance, accidents or repairs. Despite this obvious impact, for any reasonably large vehicle fleet, it’s quite feasible to keep supply relatively stable and consistent over time with carefully planned maintenance.
The distribution of demand, on the other hand, can typically be much more uneven. The overall demand for vehicles is the aggregation of specific use cases, and these use cases each have individual demand profiles with particular spikes:
- Commuters drive demand for one-way trips mornings and evenings on weekdays
- Weekend trips trigger round-trip rentals between Friday evening and Sunday night
- Grocery shopping after work results in one-way trips between 5 pm and 8 pm weekdays
- Family outings for shopping and sightseeing occur between 9 am-6 pm, Saturday and Sunday
- Outings for dinner or movies drive some late-night rental
If these represent the bulk of use cases, the aggregate demand would be quite low in the daytime during the week and very limited during the late evening and night.
If serving only these “traditional” carsharing use cases, your utilization rate may have a ceiling below 30%.
To some extent, it’s of course possible to smooth out your demand curve by raising demand for your vehicles when supply exceeds demand. Targeted marketing (promotions for low-demand periods) and dynamic pricing (reactive fee reductions) can all be used to raise demand or attract a disproportionately high percentage of the overall demand in specific time periods or locations.
However, in a competitive environment where most operators serve a similar set of use cases, it’s advantageous for carsharing operators to strategically design for serving additional, complementary use cases, to help build a more even demand curve across the entire week.
Here are some examples:
- Corporate carsharing for daytime/weekday business trips (daytime)
- Rent vehicles to Uber and Lyft drivers (evening and night)
- Rent out to delivery and household services (daytime)
With a smart selection of complementary use cases, it’s possible to smooth out demand, better matching the evenly distributed supply. The picture below shows an example of the aggregate demand for a set of use cases.

Serving these additional use cases requires an intentional approach to marketing, pricing, and potentially the composition of the fleet itself (different types of vehicles). Therefore, it’s of utmost importance that the operator has intentionally selected a set of complementary uses to focus on.
Tactical: optimize your demand fulfillment
Let’s assume the use cases have been picked strategically, the fleet has been optimized for the corresponding requirements, and the right partnerships are in place. The right audience is being targeted, at the right time, with the right message. In short, the demand is there, and it’s now about fulfilling that demand by making sure the vehicles are available when and where they are needed.
Demand prediction is the art — and science — of estimating the future demand by looking at the past. In our case, that means estimating the number of cars that will be needed in a certain location at a certain time. It’s not necessary to try and predict exactly which customer will demand a car Friday at 7 pm in a specific neighborhood, just the total number required in that area in that time slot.
Basic forecasting can be as simple as taking historical demand by day, hour, and location and making manual adjustments. Better forecasting involves training a predictive model — using non-linear regression or decision trees, for example — and also taking into account data items such as:
- Parking availability (lack of spaces pushes demand to ride sharing)
- Weather (rain increases demand)
- Time of year (more weekend trips in warmer seasons)
- Bank holidays and school holidays (fewer work trips)
- Sporting events (and other special situations)
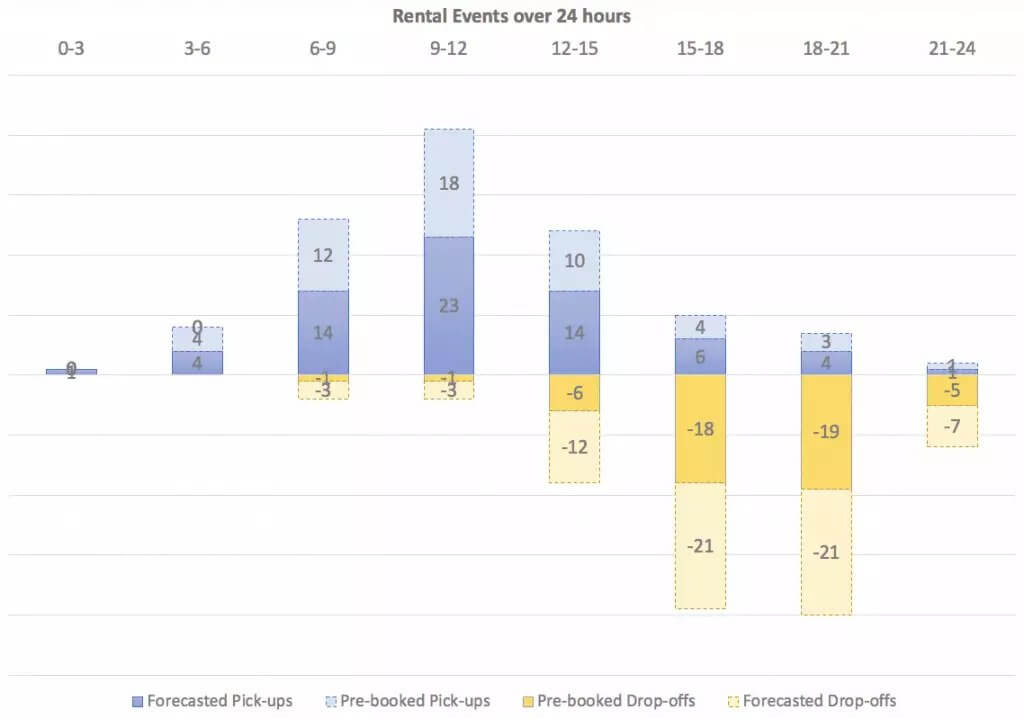
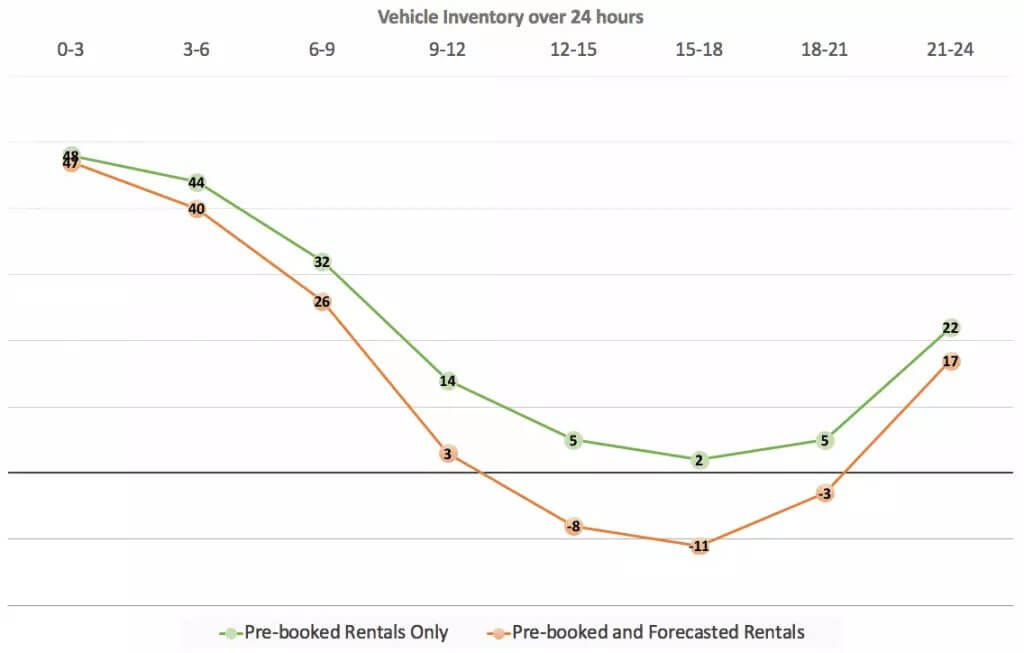
Assuming you’re operating a carsharing service with a single-vehicle type, and allow both pre-bookings as well as ad-hoc requests, the resulting demand and supply prediction could look something like this, in a particular day for a specific geographic area.


In this example, we can observe the number of pick-ups and drop-offs for pre-booked demand and forecasted demand, respectively. At the beginning of the day, we anticipate having 45 vehicles in inventory, and we further assume that we can clean and recharge a vehicle in 3 hours, so a vehicle returned in time slot n-2 is available again for rental in time slot n-3. As you can observe, we’ve got sufficient inventory throughout the day to cover pre-booked demand. However, if the forecast is correct, we’ll be out of vehicles a bit before noon, not being able to serve ad-hoc requests.
The most common solution for insufficient inventory in a location is to reposition vehicles from another location with excess supply. Tactically this is often done on a nightly basis by staff or contractors. It is also possible to provide incentives for renters to return vehicles in locations where they are needed — with an alert such as “Get $20 off your next rental by returning your car to location X today!”. Intraday repositioning is also possible, effectively akin to “delivering” a vehicle to a renter just before it’s needed. This is often done in conjunction with cleaning and charging cars covered in the next section.
. . .
Before leaving the topic of tactical supply-and-demand planning, there are several complexities which we’ve ignored above but would need consideration in a sophisticated carsharing operation.
On is the notion of location. Dividing a city into areas by neighborhoods or by other strict boundaries is in many cases a poor approximation of the distance a renter would need to walk to get to a car, as the picture illustrates.
In reality, what matters is the distance to a car for a specific renter, so in effect, each renter is surrounded by a “neighborhood” or a “home zone” within which he/she is willing to relocate to pick up a car. Ideally, those are the areas for which we need to calculate supply and demand.
Another reality is that pricing and marketing affect demand, and this can take many shapes:
- Pricing for pre-booking if cars vs ad-hoc requests will influence behavior. At the cost of margins, lower prices for booking ahead will increase pre-bookings, reducing uncertainty in demand forecasting significantly.
- Marketing and temporary promotions can drive up demand for specific locations, time slots, or vehicle types.
- Surcharging around events or other periods of peak demand can be utilized to manage demand and increase profitability (at the potential cost of user experience and brand — think Uber “surge pricing”).
As a summary, in this section, we discussed tactical approaches to increase carshare utilization. In the next section, we’ll cover operational measures.
Operational: maximize availability
During the day, there are a host of tasks that need to be carried out efficiently in order to increase utilization rates. The two most time-consuming activities involve a) servicing vehicles between rentals and b) intra-day re-positioning of vehicles to locations with a shortage or delivering a vehicle to a customer. While these activities vary depend on the service offered, in both cases the vehicle is obviously not available for rental.
To minimize the turn-around time it’s necessary to optimize the dispatching of staff, whether it’s for cleaning, refueling, or re-positioning. Again, there are approaches ranging from the basic to the more sophisticated.
- A straightforward approach is for dispatched staff to service vehicles in order of closeness, i.e. move around in the shortest hops possible. This optimizes the utilization of staff but ignores the demand and thereby would not be optimal for the utilization of vehicles.
- The inverse approach is to first service vehicles in locations where there’s a lack of available inventory, i.e. demand is higher than supply. This ignores the efficiency of the staff (more driving around), but assuming sufficient staffing would minimize the amount of unmet rental demand, thereby maximizing vehicle utilization.
- More sophisticated techniques are required to effectively balance these two conflicting objectives (efficiency of staff vs vehicle utilization). The problem is similar to well-studied mathematical optimization problems such as vehicle routing and technician dispatching. Thus, it can be solved using prescriptive analytics techniques from Operations Research and Constraint Programming.
While turn-around time matters to the bottom line, it’s important to keep perspective of the gains possible from operational decision-making. Assuming a vehicle on average is rented/serviced twice per day, then reducing turn-around time from an average of 60 minutes to 30 minutes would make the vehicle available for an hour extra each day. That hour represents a 4% increase in availability, which at best translates to a 4% increase in utilization (assuming each available vehicle is immediately rented again, which is quite optimistic).
That’s not to say that operational excellence is not necessary to increase the operator’s profitability, since the cost of operations is significant, but compared to strategic and tactical decisions, it has a smaller impact on utilization.
Summary
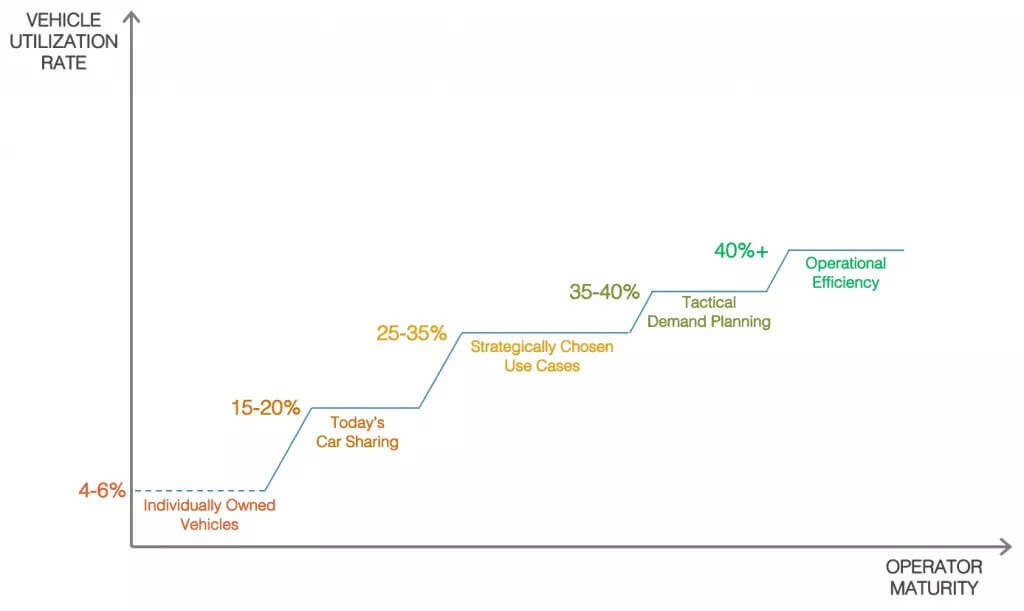
Running a profitable carsharing business in a competitive city requires good decision-making strategically, tactically, and operationally. One key driver for boosting revenue and return on assets is to increase utilization. The potential gains can be summarized as in the illustration below.

As the industry matures and carsharing operators continue to employ more sophisticated techniques, we are bound to see utilization rates increase, and thereby laying the foundation for more growth, more profits, and a quicker return on investment.
[1]Deloitte, “Car Sharing in Europe —BusinessModels, National Variations and Upcoming Disruptions”
[2] BCG, “What’s ahead for Car Sharing”
[3] FinanceMonthly, “Profitable Car Sharing: A Look Behind the Numbers”
[4] Reinvent Parking, “Cars are parked 95% of the time”
Vulog is the world’s leading tech mobility provider: we are committed to building a greener future, one city at a time.


